Read the statement by Michael Teeuw here.
MMM-Chart - View your graphs on your Mirror
-
Description:
This Module adds graphs to your MagicMirror 2.1 using your JSON source(s) from a URL.
It’s built upon the chartjs “ecosystem”.I’m currently using small PHP scripts to pull information from my own “house-database” and then let PHP create the JSON string form the data. :) You have to provide your own “data-source” of course. :)
There are A LOT of configuration options in this module. I will update the README on git later on. But if you want to know more, just read the MMM-Chart.js. I have tried to document it fairly well.
The source can be either a table of values for like this (updating the whole graph on every update):
[["2017-04-21 15:58:00",8.3,95.5],["2017-04-21 14:55:00",9.3,90.5],["2017-04-21 12:56:00",10.7,87.7],["2017-04-21 11:53:00",10.5,87.7],["2017-04-21 11:01:00",10.6,88.8]]...That will give something like this:
Screenshot:
Or you can use a “real time” source looking something like this (adding values to the graph on every update):[["2017-04-21 15:58:00",48.3,95.5,31]]Screenshot:
Both together looks like this (video):

Download:
[card:Snille/MMM-Chart]
Version 1.0
- Initial release.
This is a work in progress…
OBS: I have not yet tested this module on my RPI!!
Please come with feedback/PR:s Let me know how it works.The idea was triggered from the “dynchart module” by Chris van Marl. Thank you!
-
That looks really good. I log my sense hat readings to a file on my pi. Would it be possible to use your module to read that data?
-
@d3r Hi! Thank you. Not directly, but if you build a script (maybe in node or in PHP) that parse the file and present the data in the form of JSON, it is possible.
-
Hi all! I finally tried out the Chart module on a RPi3 (Jessie Lite install) with the latest MM2. But I can’t get the graphs to show. Is there anyone out there using my module who have it working?
The charts work fine in Chrome or Firefox on another machine… That’s how I developed the module. :) -
Hello!
I’m using dht22 modul wich is working fine, and tough will give a try with this module. I used this how-to ( http://www.instructables.com/id/Raspberry-PI-and-DHT22-temperature-and-humidity-lo/ ) to log the temps, and this php script to generate the json: ( http://www.kodingmadesimple.com/2015/01/convert-mysql-to-json-using-php.html )php //open connection to mysql db $connection = mysqli_connect("localhost","logger","password","temperatures") or die("Error " . mysqli_error($connection)); //fetch table rows from mysql db $sql = "select * from temperaturedata"; $result = mysqli_query($connection, $sql) or die("Error in Selecting " . mysqli_error($connection)); //create an array $emparray = array(); while($row =mysqli_fetch_assoc($result)) { $emparray[] = $row['dateandtime']; $emparray[] = $row['temperature']; $emparray[] = $row['humidity']; } echo json_encode($emparray); //close the db connection mysqli_close($connection); ?>This give me this result:
[“2017-07-06 11:37:59”,“26.3”,“46.9”,“2017-07-06 11:45:02”,“26.3”,“46.1”,“2017-07-06 11:50:01”,“26.4”,“45.7”,… and so on ]I set the correct url in the config, but I cant get it to work :( Maybe the result is not right?
-
and the whole “set” also needs to be inside [ ] as well. :)Here is some of my config… This is one of my graphs.
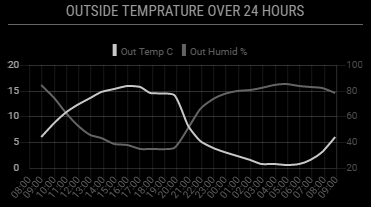
{
	module: 'MMM-Chart',
	position: 'top_center',
	header: 'Temp & Fukt Ute senaste 24 timmarna',
	config: {
		name: "outside",
		url: "http://10.0.0.20/housedata/housedata.php?id=9,10&max=24&sort=desc",
		graphStyle: "line",
		xaxisLabelTicks: true,
		updateInterval: 600000,
		graphFill0: true,
		graphLabel0: "Temp ute C",
		graphLineColor0: "rgba(200, 200, 200, 1)",
		graphTickColor0: "rgba(200, 200, 200, 1)",
		graphFillColor0: "rgba(200, 200, 200, 0.2)",
		graphFill1: true,
		graphLabel1: "Fukt ute %",
		graphLineColor1: "rgba(100, 100, 155, 1)",
		graphTickColor1: "rgba(100, 100, 155, 1)",
		graphFillColor1: "rgba(100, 100, 155, 0.2)",
		xaxisTimeUnit: "hour",
		xaxisTimeFormatLabels: "HH",
	}
},
And the JSON looks like this:
[["2017-07-07 08:56:00",16.9,85],["2017-07-07 06:58:00",13.4,91.3],["2017-07-07 05:54:00",13.3,90.4],["2017-07-07 05:02:00",13.4,89.2],["2017-07-07 03:58:00",13.6,88.2],["2017-07-07 02:55:00",13.6,90],["2017-07-07 01:50:00",13.5,91.9],["2017-07-07 00:57:00",13.6,92.6],["2017-07-06 23:54:00",13.6,90],["2017-07-06 20:55:00",20.1,67.9],["2017-07-06 19:50:00",27.1,52.3],["2017-07-06 18:57:00",25.5,55.1],["2017-07-06 17:54:00",22.4,58.1],["2017-07-06 17:02:00",22.6,66.3],["2017-07-06 15:59:00",22.1,64.4],["2017-07-06 14:56:00",22,65.7],["2017-07-06 13:49:00",21.1,66],["2017-07-06 12:57:00",19.8,66.9],["2017-07-06 11:54:00",18.7,67.1],["2017-07-06 11:01:00",17.6,75.8],["2017-07-06 09:59:00",16.5,79.7],["2017-07-06 07:50:00",12,95.5],["2017-07-06 06:58:00",10.6,98.2],["2017-07-06 05:54:00",9.4,97.7]]I think the missing fist (and last) “[” “]” may be the problem. :)
-
@Snille :) thanks! How do I add them? Can you send me the php script you are using? It will be a big help for me ! Thx
-
Hi, this is a part of my php pickup/conversion script…
I hope this can help you. :)// Get all the data from the database. foreach ($ids as $i => $idnum) { //Fetches the data from MYSQL via PDO. $values[] = getvalues($dbservername, $dbname, $dbusername, $dbpassword, $deftable, $defsensoridcolumn, $max, $ids[$i], $sort); } // Initialize the array. $outarray = array(); $first = 0; foreach ($values as $key => $value) { $position = 0; foreach ($values[$key] as $i => $value) { If ($first == 0) { $outarray[$position][] = $values[$key][$i]["time"]; } $outarray[$position][] = floatval($values[$key][$i]["value"]); $position++; } $first++; } // Make it JSON. $json = json_encode($outarray); // Print it. echo $json; -
@Snille Thanks! Will try this ! I will let you know the results :)
-
Finally it’s working :) Thanks for the help. I use googlespread sheet, csv export, and php to convert it to json. If some somebody interested I can give some help.
